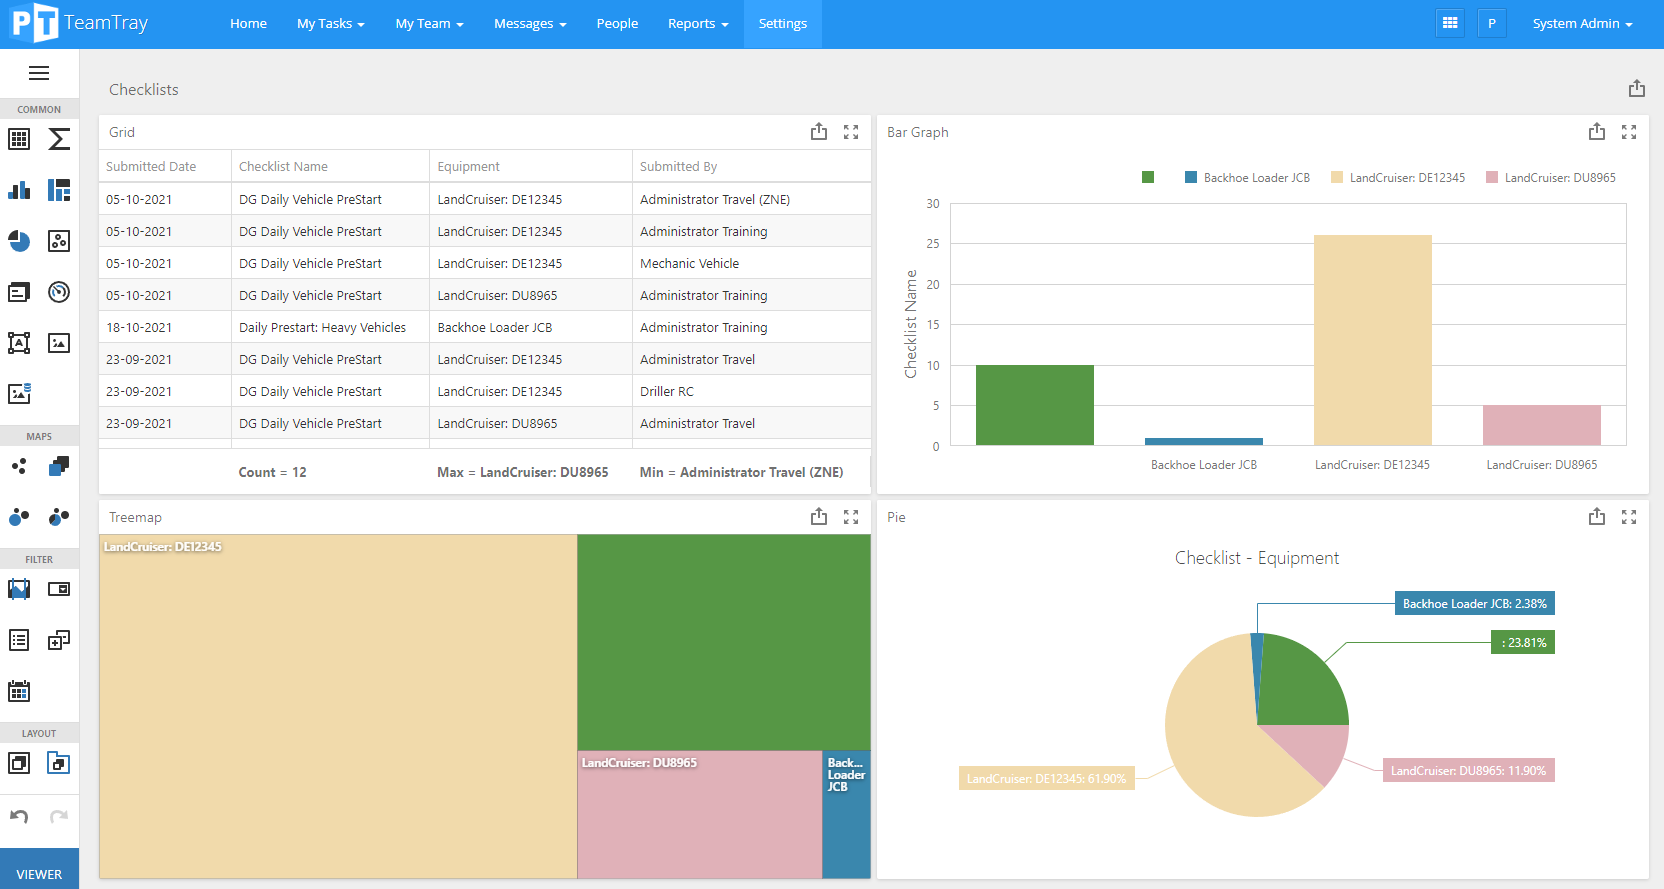
A dashboard is an easy to read, single-page, real-time user interface, showing a graphical presentation of the current status (snapshot) and historical trends of an organization's or department's key performance indicators to enable instantaneous and informed decisions to be made. The data sources used for the dashboard's are the BI APIs as discussed here.
PeopleTray's Dashboard Designer allows users to connect and visualize their data and can be deployed across users and modules.
PeopleTray utilizes the the DevExpress tool, which visualizes complex data and transforms it into digestible and appealing information.
Benefits of dashboards include the following:
-
Visual presentation of performance measures.
-
Ability to identify and correct negative trends.
-
Measurement of efficiencies/inefficiencies.
-
Ability to generate detailed reports showing new trends.
-
Ability to make more informed decisions based on collected data.
-
Alignment of strategies and organizational goals.
-
Instant visibility of all systems in total.
-
Quick identification of data outliers and correlations.
-
Time saving with the comprehensive data visualization as compared to running multiple reports.